|
|
||
 |
Supply and Demand |
|
|
|
||
Contents: |
|
|
||||||||
The demand schedule shows how much of a product people are willing to buy at a given price. A demand curve is a graphic representation of a demand schedule (chart) and is usually downward sloping. Quantity demanded only changes because of price, while demand (Demand curve) changes because of any factor other than price.
1) Price and availability of a substitute good (ex: butter and margarine)
If the price of butter goes down, then more people will buy butter meaning quantity demanded increases. Butter and margarine are substitutes because either one of them can be used instead of the other. Since the price of butter decreased, more people will buy butter over margarine, and the demand curve of margarine will shift in.
2) Price and availability of a complimentary good (ex: bread and butter)
Compliments are any two goods that �go together� in the eyes of consumers (They are used together). If the price of bread goes down, then more people will buy bread, meaning quantity demanded of bread increases. Since people need butter to put on their bread, more people will buy butter, even though the price of butter didn�t change, and the demand curve will shift out.
3) Income (Normal goods vs. Inferior goods)
a) For normal goods: as average income increases, the demand curve shifts out because people have more money to spend. Examples of normal goods are steaks and clothing.
b) For inferior goods: as average income increases, the demand curve shifts in because people have more money and they would rather buy better goods. Examples of inferior goods are $3 T-shirts and potatoes.
4) Tastes and Preferences
As tastes and preferences lean towards a certain good the demand curve for that good will shift out. For example: If Mike Piazza started wearing mini-skirts then more crazy met fans will start wearing mini-skirts and the demand curve for mini-skirts will shift out. Tastes and preferences are impossible to measure; however, economists often use proxies to measure them. They are determined by sociological factors.�
5) Price Expectations
If the expected price (future price) of a good is less then the current price, then the demand curve will shift in, because people will wait for the price to go down before they buy the good. For example: If there will be a sale in a week then until the sale takes place the demand curve will shift in. (Sales are only temporary) The exceptions to this rule are necessities because people need them and can�t wait until the price goes down.
6) Stock of Good in Consumer Hands
If people already have a good then they will not be as willing to buy another so the demand curve for that good shifts in.
7) Population
As the population increases the demand curve for the average good usually shifts out.
Individual Demand and Market Demand:
The market demand is the sum of all the individual demands at each price. You add them horizontally. The exceptions to this are public goods (Bridges), which you add vertically.
A Vertical Demand Curve
This is a demand curve, where price does not affect quantity demanded. For example: Salt, addictive goods, and required medicine.
The supply schedule shows how much of a product companies, or firms, are willing to produce at a given price. A supply curve is a graphic representation of a supply schedule (chart) and is usually upward sloping. Quantity supplied only changes because of price, while supply (Supply curve) changes because of any factor other than price.
1) The Price and Availability of Resources
If it costs less to produce a certain good then a company, or firm, can produce more of that good with the same amount of money, hence, the supply curve will shift out.
2) Changes in Taxes and Subsidies
As taxes increase companies, or firms, cannot produce the same amount of a good with the same amount of money, therefore, the supply curve shifts in. Subsidies are negative taxes and have the opposite effect on the supply curve.
3) Technology
As technology improves companies, or firms, are able to produce more of a good with the same amount of money, hence, the supply curve shifts out.
4) Price Expectation for Sellers
As the expected price of a good increases companies, or firms, are willing to supply more of that good, therefore, the supply curve shifts out.
5) Number of Companies, or Firms, in the Market
If there are more companies, or firms, producing a certain good then the supply curve of that good shifts out.
6) Substitute in
Production
If the price of a good increases its quantity supplied increases and the supply curve of a substitute good will shift in. A substitute is a good that can be produced with the same resources.
Vertical Supply Curve
A vertical supply curve is when price does not affect quantity supplied. (Also regular goods in a short term)
The price and quantity of a product in the marketplace is determined by where the supply and demand curves intersect (Also called the market-clearing price). This is called market equilibrium. At a price higher than the equilibrium price there is a surplus (More supplied than demanded) and at a price lower than the equilibrium price there is a shortage (More demanded than supplied).
1) Effects of shifts in Supply & Demand on Equilibrium Price
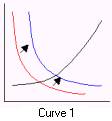
a) Curve 1- this happens when any of the 7 factors that affect the demand curve cause the demand curve to shift out. When the demand curve shifts out the equilibrium price and quantity increase.
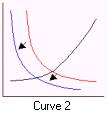
b) Curve 2- this happens when any of the 7 factors that affect the demand curve cause the demand curve to shift in. When the demand curve shifts in the equilibrium price and quantity decrease.
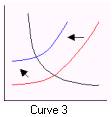
c) Curve 3- this happens when any of the 6 factors that affect the supply curve cause the supply curve to shift in. When the supply curve shifts in the equilibrium price goes up and the equilibrium quantity goes down.
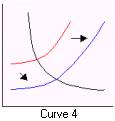
d) Curve 4- this happens when any of the 6 factors that affect the supply curve cause the supply curve to shift out. When the supply curve shifts out the equilibrium price goes down and the equilibrium quantity goes up.
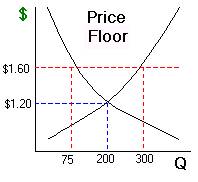
2) Price ceilings and floors
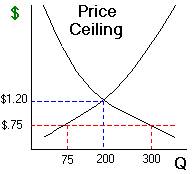
a) Price ceiling- a price ceiling is a maximum price that sellers are allowed to charge for a certain good. The price ceiling in the example above caused a shortage of 225 of the good shown (Quantity demanded at the price ceiling-$.75 is 300, while quantity supplied is 75). A price ceiling is only effective when it is below the equilibrium price.
b) Price floor- a price floor is a minimum price that sellers are allowed to charge for a certain good. The price floor in the example above caused a surplus of 225 of the good shown above (Quantity demanded at the price floor-$1.60 is 75, while quantity supplied is 300). A price floor is only effective when it is above the equilibrium price.
Application of Supply and Demand to Major Issues
A) The Economics of Agriculture
The price of farm products has decreased greatly over the last 100 years. This happened because the supply curve shifted out a lot as a result of major technological advances, while the demand for food increased less than proportionately with income. To help increase farmer income the government placed crop restrictions. By limiting the supply of crops, in effect, the government shifted the supply curve in raising prices and farmer income.
B) Impact of a Tax on Price and Quantity
A tax incidence is the ultimate economic effect of a tax on the real income of consumers or producers. Thus a sales tax may be paid by a retailer, but it is likely that the incidence falls on the consumer. The exact incidence of a tax depends on the price elasticity of supply and demand. The general rule of determining the incidence of a tax is: The incidence of a tax denotes the impact of the tax on the incomes of producers and consumers. In general, the incidence depends upon the relative elasticity of demand and supply. A tax is shifted forward to consumers if the demand is inelastic relative to supply; a tax is shifted backward to producers if supply is relatively more inelastic than demand.
C) Applications of Minimum Floors and Maximum Ceilings
1) The Minimum-Wage Controversy (Minimum-price floors)
The minimum-wage controversy is a debate whether raising the minimum wage rate will be bad for the economy or not. Those who argue that it will not be bad for the economy, argue that if the minimum wage rate is increased moderately then the increase will not jeopardize employment opportunities. Others argue that if you raise the minimum wage rate you will put people out of work. If you look at a supply and demand diagram then creating a price floor (Raising minimum wage rates) will in fact decrease employment (less of a demand for workers at that price) of unskilled workers. However, several economic studies show that the effects of this decrease in employment would be very small. Another factor in minimum-wage controversy relates to the impact of the minimum wages on incomes. Raising the minimum wage would increase the incomes of lower income workers as a whole. Those who argue for an increase in minimum wage hold that this increase in income is worth the small increase in unemployment. Those who argue against an increase in minimum wage argue that the increase in income is not worth the small increase in unemployment. Some people argue that using the wage system is not the way to transfer buying power to lower income groups and would prefer direct income transfers or government subsidies.
2) Energy Price Controls
Because of non-economic factors, such as: political disturbances as well as booming demand and limited supply, the price of oil has increased greatly. To combat this the government can place a price ceiling on oil. This would cause a shortage of oil in the market. The government would have to decide who gets the limited amount oil supplied. One way to decide this would be first come first serve. Another way to decide this would be to ration the oil by distributing coupons based on need. For this to be effective the government would have to limit demand to the potential equilibrium demand at the ceiling price.

Return to Senior Review Sheets